The classical school is the simplest, oldest, and most important approach in technical analysis. It includes the fundamental principles of market study and is well-suited for beginner traders due to its simplicity and ease of application. In the following lines, we will explain it in detail.
The Classical School of Technical Analysis
It is a method for analyzing and understanding the market that relies on core rules and principles for reading charts and trading. It focuses on historical data and the price patterns shown on charts in order to understand market conditions and predict future behavior. It does not depend on technical indicators or complex analytical tools.
The classical school is closely related to Dow Theory, which established the foundations of market analysis and the initial rules for studying it.
Principles of the Classical Technical Analysis School
These are the main pillars and tools on which the classical approach is based:
1- Price reflects everything: It is a mirror of market conditions, investor sentiment, expectations, and how an asset is affected by the economic environment.
2- Market trends and trendlines: These define the direction in which the price is moving.
3- Support and resistance levels: These identify price zones where reversals are likely to occur.
4- Price patterns and chart formations: These help visually identify market direction, whether it will continue or reverse.
5- Time analysis of the market: This shows market behavior across different timeframes and allows comparison between them.
Advantages of Classical Analysis
1- Understanding market conditions and price behavior to make better trading decisions.
2- Identifying primary and secondary trends and how to trade based on them.
3- Recognizing potential reversal zones and predicting the start and end of corrections.
4- Using price patterns to gain deeper insight into the market and identify opportunity zones and exit points.
5- It forms the foundation of technical analysis used in other schools.
6- It can be combined with other strategies and approaches for more comprehensive analysis.
7- It is easy to learn and apply, especially for beginner traders.
8- Its patterns are easy to recognize and clearly visible.
Explanation of Classical Technical Analysis
First: Support and Resistance Levels
These are among the earliest and most important foundations of trading analysis. They are price levels that tend to repel or reverse price movements when reached.
Support level:
A level that supports the price and pushes it upward. The market falls to this level, and it acts as a floor, causing the price to rise again.
Resistance level:
A level that resists price increases. The market rises to this level, and it acts as a ceiling, forcing the price to decline.

The strength of these levels increases when they appear on higher timeframes or when the price has rebounded from them multiple times.
Breakout
When a breakout occurs, if the price breaks through a level, the role of that level changes. A support level turns into resistance, pushing the price further downward to test the next support level. Likewise, when a resistance level is broken, it turns into support, helping push the price upward toward the next resistance level.
Second: trend lines
A trendline is a line drawn to determine the direction of the market, helping traders decide which trades are appropriate.
The Importance of Drawing Trendlines
The type of trade depends on the market direction. In an uptrend, traders wait for the price to touch the trendline as a support level and then enter buy positions. In a downtrend, traders wait for the price to touch the trendline, which acts as resistance, and then enter sell positions.
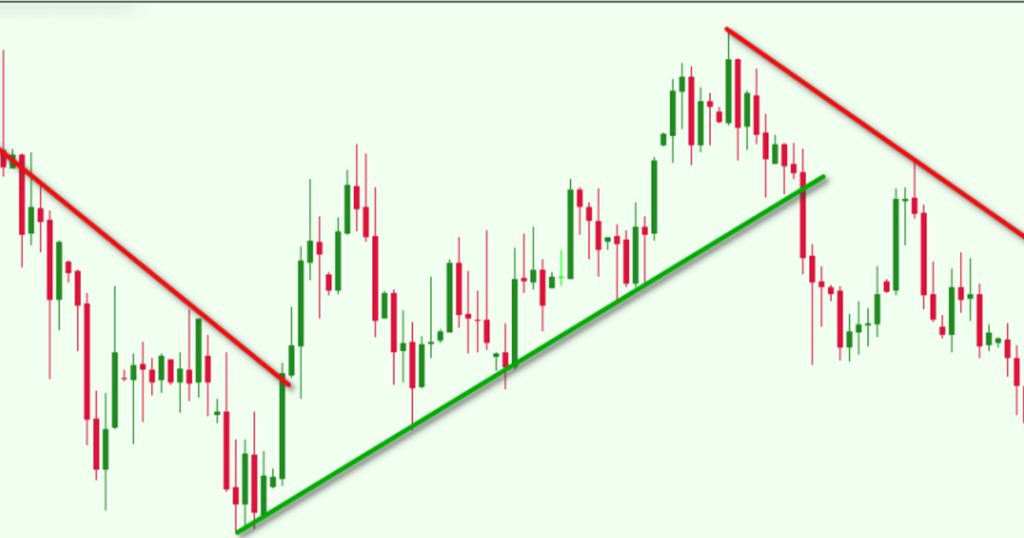
How to Identify the Trend
1- An uptrend line is drawn by connecting higher lows.
2- A downtrend line is drawn by connecting lower highs.
3- In a sideways trend, the highs are connected with a horizontal upper line, and the lows are connected with a horizontal lower line.
Third: Classical Technical Analysis Patterns
By simply looking at a chart, one can often recognize its shape, which reflects whether the market is nearing a reversal or continuing in the same direction. These patterns include:
1. Continuation Patterns
These are patterns that indicate the trend is likely to continue in its current direction.
2. Reversal Patterns
These are patterns that signal a potential reversal in the trend.
In terms of structure, there are large, clearly visible chart formations that represent a significant portion of the price movement. In this section, we will explain the most important ones.
Explanation of Classical Chart Patterns
Through the classical school, traders can identify several clear patterns at a glance. When combined with support/resistance levels and trendlines, the analysis becomes more reliable and clearer. Among the most well-known patterns:
Double top- 1
The double top is a reversal price pattern consisting of two equal peaks followed by a price decline. Both peaks form at the same resistance level and typically appear at the end of an uptrend, indicating weakness in the trend and the likelihood of a reversal.
Market Entry:
A sell position is initiated after the price breaks the neckline, which is the baseline connecting the lows between the two peaks, or the support level formed at the trough between them, as illustrated in the chart.

Triple top- 2
This pattern consists of three peaks of equal height, with each peak reversing from the same resistance level. This formation typically precedes a price decline and the development of a downtrend, making it a reversal pattern. Market entry is executed in the same way as the previous pattern.
3- Double and triple bottom-
These are also reversal patterns and are essentially the opposite of the double and triple top patterns.
The double bottom consists of two equal lows, where each low rebounds from the same support level. This pattern usually precedes a reversal into an uptrend.
The triple bottom consists of three lows, indicating that the price is likely to move upward as well.
Market Entry:
A buy position is initiated at the neckline to confirm the validity of the pattern and the beginning of an upward trend.

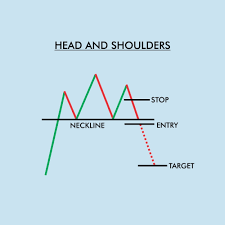
Head and shoulders- 4
This is one of the most well-known reversal patterns in classical technical analysis. It typically signals a shift to a downtrend. The pattern consists of three peaks, with the middle peak (the “head”) being the highest, while the first and third peaks (the “shoulders”) are approximately equal.
Market Entry:
A sell position is opened after the price breaks the neckline.
The inverse of this pattern consists of three troughs, where the middle trough is the lowest, and the first and third troughs are at similar levels. This formation usually precedes a reversal into an uptrend.
Market Entry:
A buy position is opened after the price breaks the neckline.
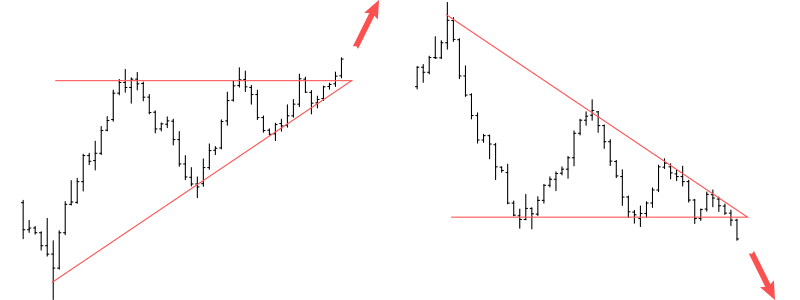
5 Triangles-
A- Ascending Triangle:
In this pattern, the upper boundary is a horizontal resistance level, while the lower boundary slopes upward. This indicates that the price is likely to break out to the upside.
Market Entry:
A buy position is opened after the breakout above the resistance level.
B- Descending Triangle:
In this pattern, the lower boundary is a horizontal support level, while the upper boundary slopes downward. This suggests that the price is likely to break out to the downside.
Market Entry:
A sell position is opened after the breakout below the support level.
C- Symmetrical Triangle:
In this pattern, both sides are sloping—one upward and the other downward—gradually converging. It reflects market indecision, with price fluctuating between buyers and sellers. The price may break out above the upper boundary and move upward, or break below the lower boundary and move downward. However, the breakout aligns with the prevailing trend, as the symmetrical triangle is generally considered a continuation pattern, meaning it tends to follow the existing direction, as illustrated in the figure below.
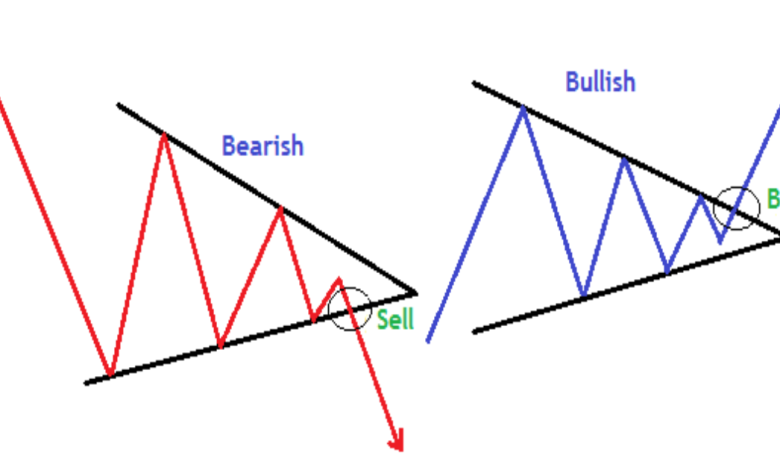
Market entry: If the price breaks the lower boundary, we sell; if it breaks above the upper boundary, we buy.
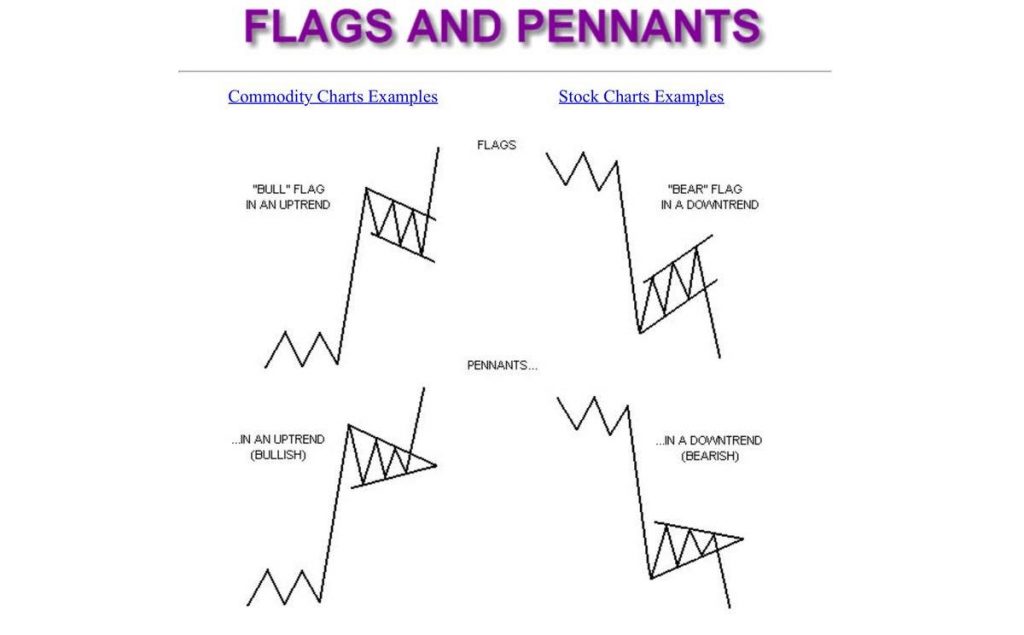
Flags and Pennants – continuation patterns:
These are continuation patterns that form before the trend resumes its direction. They typically last from one to three weeks and help identify entry and exit points. After confirming a breakout, we initiate the trade.
The pattern consists of:
A) The pole (or mast):
This is a sharp price movement—upward in an uptrend and downward in a downtrend. It is called the flagpole, and it usually occurs with high trading volume, pushing the price strongly in the direction of the trend.
B) The flag (or pennant):
After the pole, a slower price movement occurs, forming the flag shape. This can appear as a small symmetrical triangle or a narrow price channel. A breakout then occurs in the same direction as the pole, allowing the price to continue its main trend.
Market entry: If the price breaks above the upper trendline, we buy; if it breaks below the lower trendline, we sell. The direction of the pole should match the overall market trend.
Disadvantages of classical analysis
1- Classical analysis aims to predict possible price movements, but it cannot be considered fully accurate. Its tools should be combined with other modern tools.
2- It is not effective in analyzing markets during periods of high volatility or instability, where price fluctuations are significant, making it difficult to apply.
3- Some classical chart patterns are difficult to identify, requiring a long time to gain the experience and skill needed to understand them.
4- It focuses on price movements while neglecting other analysis methods, especially fundamental analysis and political news, which also have a major impact on the market.
From technical analysis course articles:
Introduction to Technical Analysis
Technical analysis terms.
Schools of Technical Analysis
What is Price Action?
Wycoff theory
Elliott Wave Theory
Dow Theory
Pivot Point
Multiple Time Frame Analysis
Technical indicators
How to Read Charts
Harmonic Trading School