What is price action? This question often comes to mind for anyone exploring different schools of technical analysis and methods of reading charts. In this article, we’ll cover the concept of price action and how to apply it when analyzing charts.
Price action
Price action refers to the way the market moves and reacts under various conditions and influences. This behavior is driven by supply and demand, as well as the psychological changes in market sentiment and investor attitudes. Price action becomes evident through historical price data, recent movements, support and resistance levels, and overall trends.
Trading with Price Action
The price action approach relies on analyzing the data presented directly on the chart, without using complex technical indicators. By identifying chart patterns, candlestick formations, trends, and key levels, traders can anticipate future price movements, make decisions, and identify optimal entry zones.
Principles of Trading Using Price Action
1- Focus on price movement, as it directly reflects the state of the market.
2- Avoid reliance on technical indicators, as they are more complex compared to interpreting raw price data, whether historical or recent.
3- The overall market trend indicates the path the market is taking and potential future scenarios. It is also the basis for choosing trade types and how a trader interacts with the market.
4- Study Japanese candlestick patterns, as each pattern reflects investor sentiment and indicates whether a trend will continue or reverse. These are among the most important tools for predicting price movement.
5- Support and resistance levels should be viewed as zones where price may reverse or behave differently if broken.
6- Understanding market psychology is essential for interpreting price movement, as it clearly reflects investor sentiment.
Elements of Price Action
Market analysis in this approach is based on the following elements:
1- Market trend.
2- Support and resistance levels.
3- Japanese candlesticks.
4- Market psychology.
How Does Price Action Work?
Price and its interaction with market conditions over time are the key to chart analysis. This approach is similar to classical technical analysis in its simplicity, as it relies on reading the market through prices alone. Prices provide a clear picture of what is happening in the economy, and price patterns represent its various states and conditions.
To begin applying price action, it’s important to understand its core elements and how to incorporate them into a trading strategy.
Reading Price Action
Before reacting or making decisions, traders interpret price behavior through the following:
1- Identifying the Trend:
By observing highs and lows and drawing trend lines. Their formation reflects buying momentum or selling pressure. A trend break and the formation of a new trend help identify future opportunities and trade zones.
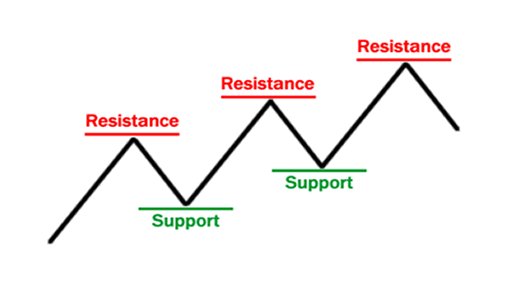
2- Identifying Support and Resistance Levels:
These levels help anticipate potential reversals, especially if they are historical (tested over months or years). Price behavior around these levels determines its next direction.
3- Reading All Technical Patterns:
These include:
A- Chart Patterns:
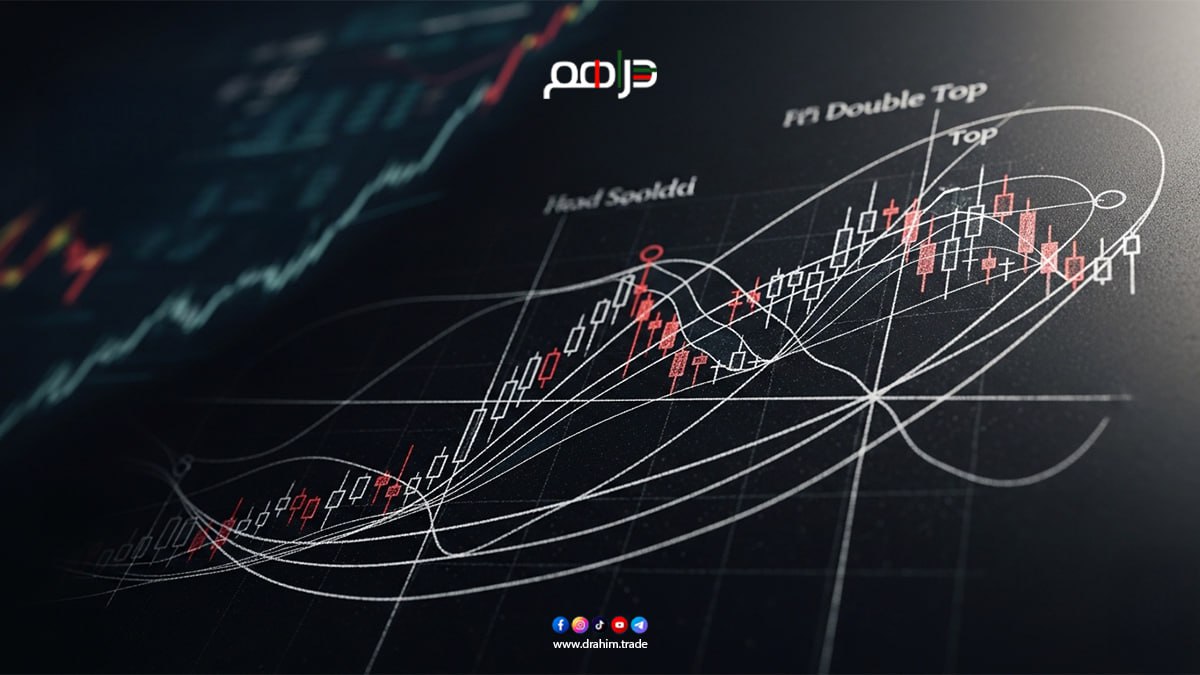
The structure of the chart reflects the current and expected market condition. For example, double tops or double bottoms often indicate a potential reversal.
B- Japanese Candlestick Patterns:
Candlesticks reveal investor reactions and the dominance of bulls or bears, indicating prevailing sentiment and possible shifts. Some patterns consist of one candle, others of two or three.
4- Comparing Timeframes:
Analyzing price action across different timeframes helps interpret historical, medium-, and short-term data. This involves identifying the overall trend on higher timeframes, then analyzing changes on lower timeframes accordingly.
For a comprehensive understanding of chart components, we recommend reading our educational articles.
Introduction to Technical Analysis
Advantages of Price Action Trading
1- A simple and straightforward method that beginners can learn with practice.
2- Observing price behavior provides a reliable and realistic reflection of market changes.
3- Helps traders develop observation, interpretation, and visual analysis skills.
4- Quickly reflects investor sentiment and current market psychology.
Price Action Patterns
Understanding price action requires familiarity with common patterns, including:
1- Bounce:
A price reversal after touching a support or resistance level.
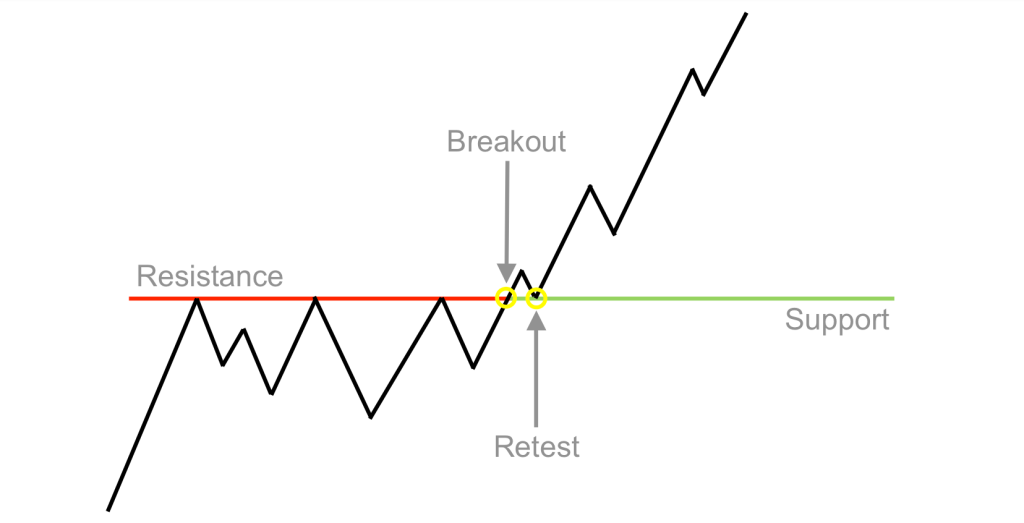
2- Breakout:
When price breaks through a level, indicating strong momentum or weakness in that level. A broken resistance often becomes support, encouraging further upward movement, while a broken support becomes resistance, limiting upward movement.


3- Correction :
It is a temporary change in the trend, where the price reverses direction for a short period until it finds a level that helps it continue the main trend. In an uptrend, the price declines until it reaches a support level that allows it to resume rising, while in a downtrend, the price rises until it reaches a resistance level that pushes it back to its original path.
4- Reset :
It is a behavior the price exhibits after a breakout, serving as confirmation that the breakout is valid. After the price moves beyond a certain level, it often returns to it after a relatively short period to retest it, then continues moving in the new direction.
If the price breaks an upward trend, this indicates the strength of sellers. It will then return to retest the resistance level where the break occurred, after which a downtrend begins. Similarly, if a downward trend is broken, this signals the emergence of buyer dominance. The price then returns to the support level to retest it before starting an upward trend.
Sometimes, after a period of time, the price may revisit a level that previously caused it to reverse direction. It may either succeed in breaking through it or bounce off it again.
What is the difference between a correction and a retest?
Correction:
This refers to a temporary pullback after which the price returns to its original trend. In this case, the market continues to respect the support and resistance levels that define the main trend.
Retest:
In this case, the price does not return to its original path. After a breakout and subsequent retest, a new trend is formed, and support turns into resistance and vice versa.
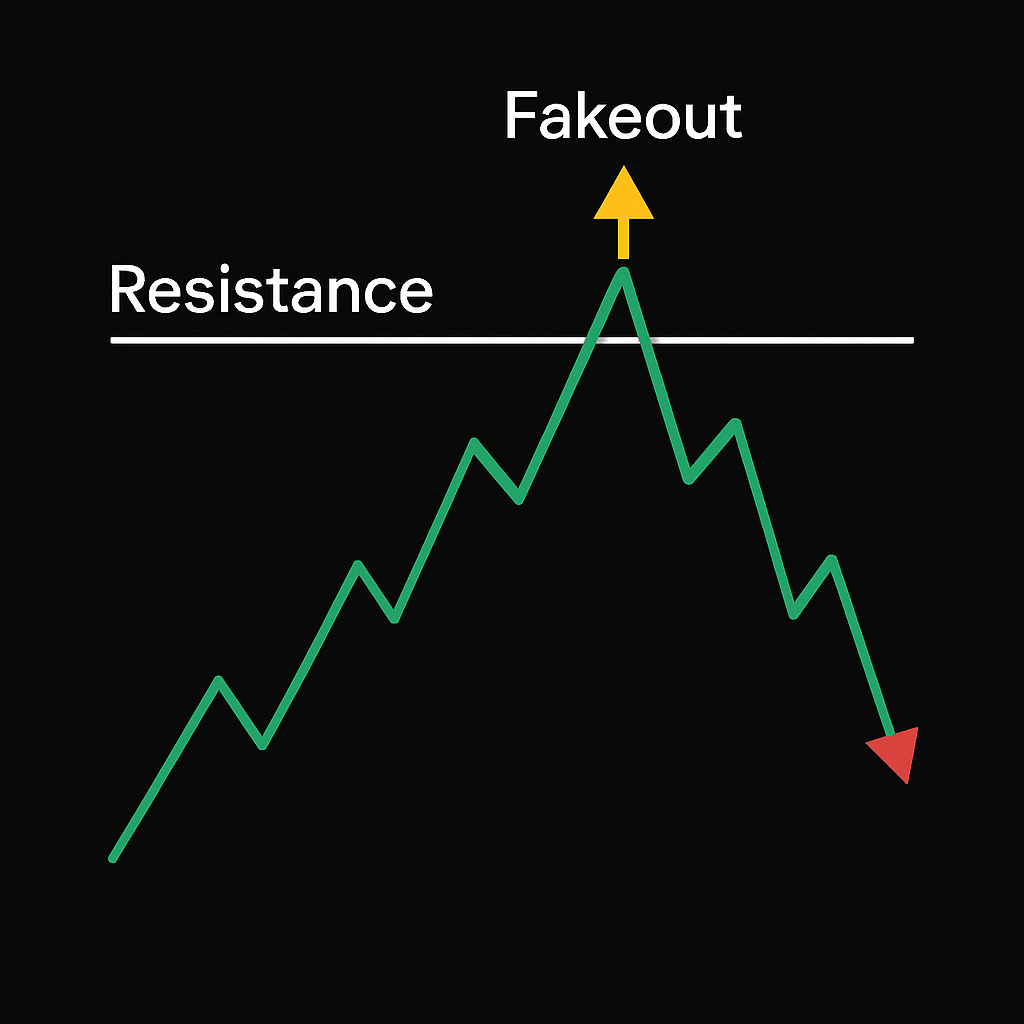
5- Fakeout (False Breakout):
Not every breakout of a trend or level means the trend will change. Sometimes a false breakout occurs, where the price temporarily breaks a trendline, a level, or the path connecting highs or lows, but this does not lead to a real trend reversal. After the break, the market resumes its original direction.
To confirm whether a breakout is valid or false, traders usually wait for a retest, as mentioned earlier.
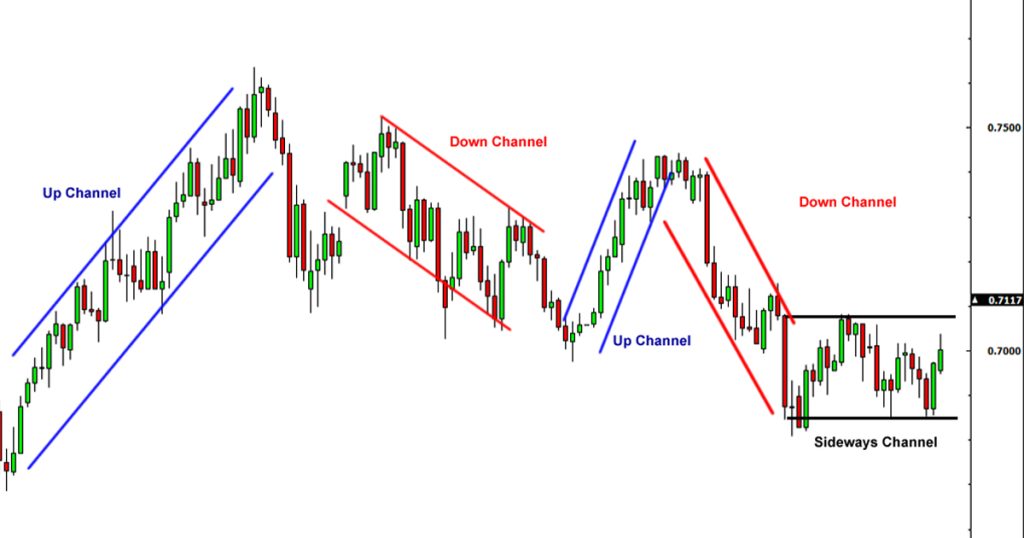
Price channel :
Price channels are formed when the price moves between a support level and a resistance level, creating a shape similar to a tube. They occur in the following cases:
A. Sideways trend: where the price moves slowly within a range before a reversal or breakout occurs.
B. Sloping channels: which can be upward in an uptrend or downward in a downtrend. In this case, support and resistance levels shift along with the trend, while highs and lows remain parallel.
Types of Price Channels:
A. Horizontal channel: formed during a sideways trend.
B. Ascending channel: formed in an uptrend as an alternative way to represent the trend.
C. Descending channel: formed in a downtrend, where the trend is illustrated as a channel rather than a single line.
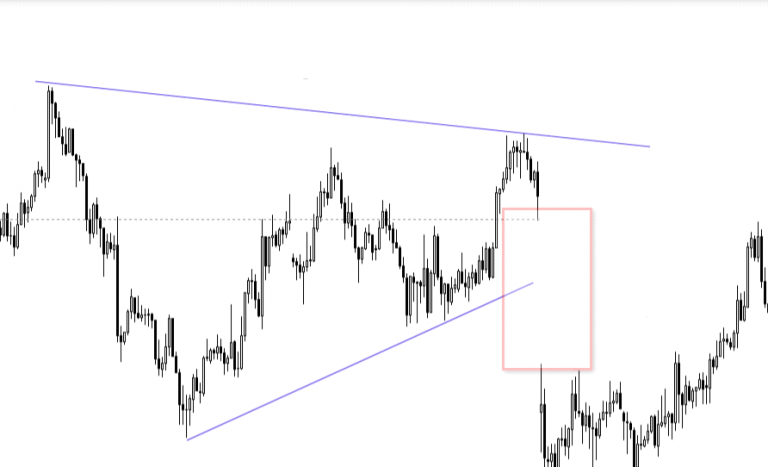
7- Price gap :
It is a gap that appears in the price path on a chart. It can be used as a potential future entry point, as it tends to attract price back to it. It forms as a result of:
A. A significant difference between the closing price of the previous session and the opening price of the current session, especially after market holidays.
B. It may also occur following breaking news or a major event that significantly shifts investor sentiment in the market.
Combining Price Action Patterns
The key to mastering technical analysis using price action lies in the ability to combine all chart elements. This isn’t difficult, but it requires practice and continuous market observation under different conditions. By identifying the trend and key levels, then analyzing candlestick patterns, traders can anticipate future price movements.
How to Use Candlesticks with Support and Resistance
1- Draw the trend and mark levels around the price—resistance levels above and support levels below.
2- Observe candlestick patterns at these levels:
If continuation patterns appear, it indicates the trend is likely to continue.
If reversal patterns appear—such as a hammer at support or a hanging man at resistance—it signals a potential reversal.
How to Set Entry Points
1- In an uptrend:
Start a buy position at a support level, preferably a strong one. The more often price has bounced from it historically, the stronger it is. Enter the trade after confirming the candlestick pattern and a retest of the level.
2- In a downtrend:
Start a sell position at a resistance level, also waiting for confirmation from candlestick patterns and a retest.
3- When a reversal is confirmed:
A trend reversal is confirmed after the appearance of reversal patterns or a breakout of a trend or level. Then monitor whether the breakout is valid or false. If it’s valid, you can enter the market.
How to Set a Stop-Loss Order
This is essential for risk management when executing trades:
In an uptrend: place the stop-loss below the support level or below the most recent low.
In a downtrend: place the stop-loss above the resistance level or above the most recent high.
Conclusion: What is Price Action?
Price action is the behavior of price as a result of changing market events and investor sentiment. Its analysis relies on observing and interpreting price movements without using technical indicators or complex tools.
Final Advice
Relying solely on price action is not enough to fully understand the market. It is better to combine both technical and fundamental analysis to build a comprehensive view and avoid poor decisions.
From Our Technical Analysis Course Articles