Understanding Wyckoff Theory can help traders interpret different market phases in terms of investor behavior and market reactions. In this article, we explain the theory, its core principles, and how it can be applied in trading.
What is Wyckoff Theory?
Wyckoff Theory is a market analysis and trading methodology developed by Richard Wyckoff. It is based on the concept of supply and demand as one of the primary drivers of the market. The theory provides a framework for analyzing price movements, trading volume, and investor sentiment to anticipate future market trends.
Objectives and Uses of Wyckoff Theory
1- Analyzing Market Movements
The theory focuses on understanding the behavior of large institutions and major investors who have the power to move the market. By aligning trades with these trends, traders can increase their chances of making profits.
2- Understanding Trading Volume
It helps identify market liquidity and how quickly investors react to changes.
3- Predicting Price Reversals
The theory is useful in identifying the right time to enter the market, especially at the beginning of a new trend. Since markets move in cycles, recognizing recurring patterns helps predict the next phase.
4- Assessing Market Sentiment
Market trends are driven by investor sentiment, buying and selling activity, and expectations about the future.
The Concept of Supply and Demand
Every asset’s price is determined by the law of supply and demand. The value of anything depends on how much demand exists relative to its supply. If demand exceeds supply, prices rise; if supply exceeds demand, prices fall.
Impact of Supply and Demand on Price Charts
This principle directly affects price movements on charts. When demand increases—due to higher investor interest—buying activity rises, pushing prices upward. The stronger the buying pressure and trading volume, the stronger the uptrend.
Conversely, when demand decreases and investor interest declines, selling activity increases, driving prices downward. The greater the selling pressure, the sharper the decline.
Trading Volume
Trading volume refers to the level of market activity and the number of transactions. High trading volume indicates strong liquidity and faster market movement, which increases opportunities to profit from price differences and reduces spreads (transaction costs).
On the other hand, low trading volume means low liquidity and slower market movement, making the market less attractive due to limited profit potential and higher spreads.
Core Laws of Wyckoff Theory
Before applying the theory, it is important to understand its foundational principles:
1- Supply and Demand Law
Monitoring supply and demand helps interpret market direction, as sentiment drives price movements.
2- Cause and Effect Law
The “cause” refers to accumulation or distribution phases (e.g., heavy selling leading to a support level), while the “effect” is the resulting price movement (e.g., a strong upward trend after a selling climax).
3- Effort vs. Result Law
“Effort” represents trading volume, while the “result” is the price movement. For example, high volume during an uptrend followed by limited price progress may signal a potential reversal.
Explanation of Wyckoff Market Phases
According to the theory, the market moves through four main phases:
1. Accumulation (Accumulation Phase):
This phase occurs after a prolonged downtrend when the market reaches a state of overselling. Selling pressure decreases as large investors begin accumulating assets quietly. This phase often appears as a sideways trend or a base forming at a support level.
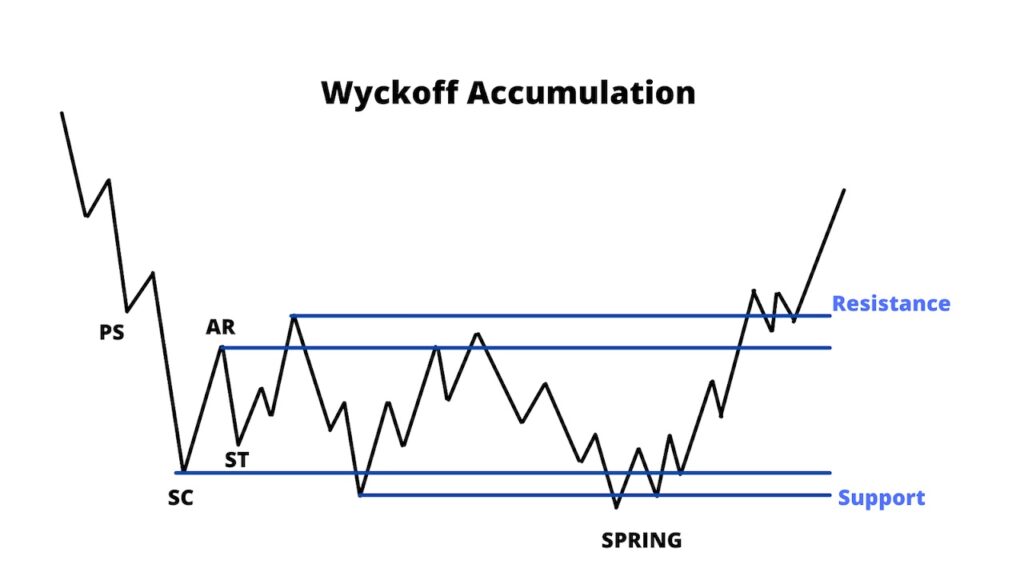
2- Uptrend (Markup Phase):
As a result of the first phase, what is known as buying pressure begins to form. This reflects bulls taking control of the market. This pressure—often following a selling climax—is what drives the trend strongly upward.
3- Distribution Phase:
This phase forms after the market reaches a buying climax or overbought condition. As bulls complete their positions and take profits, they begin to exit the market. This phase may appear as a short sideways trend or a peak at a resistance level.
4- Downtrend (Markdown Phase):
As a result of the distribution phase and the market becoming saturated with buying activity, selling pressure begins to emerge. This pulls the trend downward, as bears take control of the market after the bulls’ role has ended.
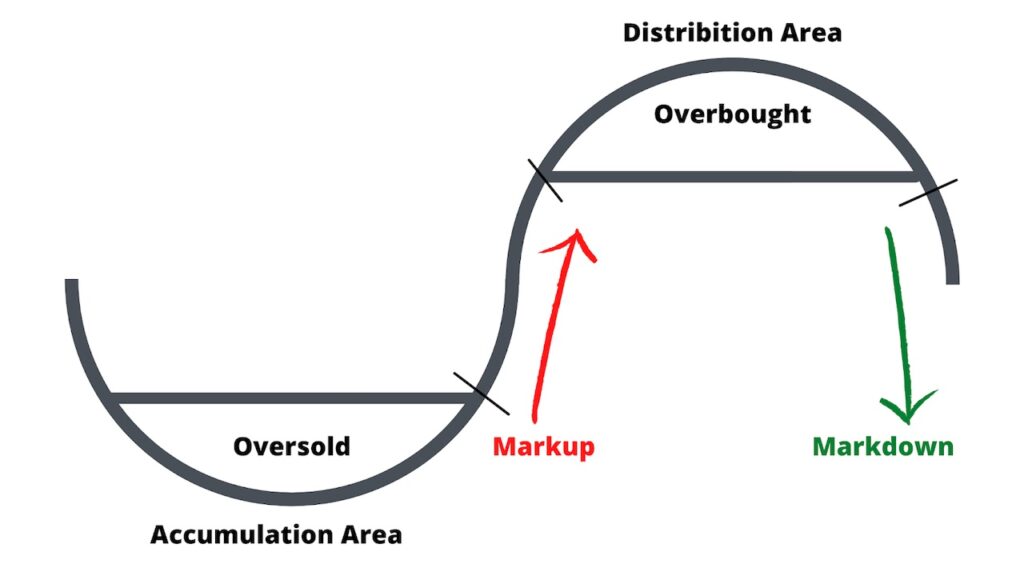
We can conclude from these phases that:
1- Overselling creates buying pressure.
2- Overbuying creates selling pressure.
Trading Using Wyckoff Theory
After understanding Wyckoff Theory, a key question arises: how can it be applied in trading? How can traders identify each market phase, determine entry points, and anticipate price behavior to capitalize on opportunities?
Applying Wyckoff Theory in Trading
The theory can be implemented through the following steps:
1- Select the market or currency pair
Choose a chart that is clear and where market phases can be visually identified.
2- Determine the primary market trend
This helps in deciding the type of trade (buy or sell).
3- Identify market phases on the chart
Recognizing accumulation, markup, distribution, and markdown phases before entering any trade is essential.
4- Anticipate future price behavior
Once phases are identified, traders can predict the next likely movement.
5- Buying strategy (at support levels)
Enter buy positions at support zones after confirming the end of accumulation and the beginning of an uptrend, often with a retest.
Place a stop-loss below the support level based on a predefined risk percentage or if the price moves against expectations.
6- Selling strategy (at resistance levels)
Enter sell positions at resistance levels after confirming the end of distribution and the beginning of a downtrend, also with a retest.
Supporting tools such as technical indicators and Fibonacci levels can be used.
Place a stop-loss above the resistance level according to the trader’s risk tolerance or if the price continues to rise.
Advantages of Wyckoff Analysis
1- Applicable across a wide range of financial markets.
2- Helps predict future price trends and prepare for them.
3- The Wyckoff model is relatively easy to understand and apply, making it suitable for both beginners and experienced traders.
What Do We Gain from Richard Wyckoff’s Theory?
Beyond its practical uses, this analytical approach trains traders to understand how key market factors—such as supply and demand and liquidity—affect price movements. It also helps traders evaluate the strength of each factor in driving the market and trader activity.
Additionally, by observing price action, traders learn to connect these factors with potential price movements and identify ways to take advantage of them effectively.
Disadvantages of Wyckoff Theory
1- During sudden market movements or breaking news, the market may behave contrary to expectations, making the theory less reliable.
2- Market phases are not always easy to identify, especially in complex chart patterns, requiring continuous practice.
3- في بعض الحالات تكون إشارات النظرية خاطئة، وذلك عندما لا يتحرك السوق حسب مراحل النظرية، وهذا يبرز أهمية وضع أمر وقف الخسارة.
From technical analysis course articles: