Technical indicators are among the most important tools used when analyzing markets and applying trading strategies. Each indicator has a different function, calculation method, and category. In this guide, we explain how they work, their types, and how they can be used effectively in technical analysis.
Technical indicators
They are analytical tools based on mathematical formulas used to study price movements, market trends, momentum, and other data displayed on trading platforms. These indicators produce signals that help traders identify potential entry opportunities and provide a clearer view of price behavior, which can assist in forecasting future market movements.
Uses of Technical Indicators
1- Help clarify trading volume, trend direction and strength, and overbought/oversold levels.
2- Provide a deeper and more comprehensive understanding of the market.
3- Assist in identifying entry and exit points through trading signals and reversal zones.
4- Offer Price Movement Forecasts
that can be used to maximize profits or minimize losses.
5- Can be applied across all asset classes, including forex pairs, commodities, and stock indices.
Types of Indicators Based on Display
1. Oscillators (Separate Indicators)
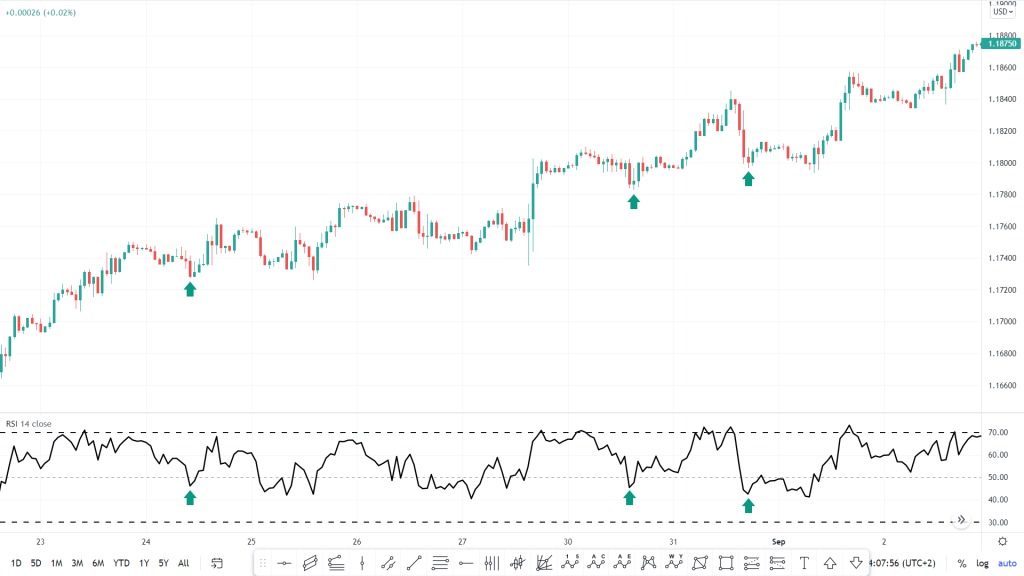
These appear in a separate window below the chart. An example is the Relative Strength Index (RSI), which moves between 0 and 100:
Near 0 → Oversold
Near 100 → Overbought
Overlays indicators
These are plotted directly on the price chart, such as Moving Averages.
Types of Indicators Based on Usage
First: Trend Indicators
These focus on identifying the current price direction using historical data.
Moving Average (MA):
Measures the average price over a specified period.
Common types:
Simple Moving Average (SMA)
Exponential Moving Average (EMA)
(SMA) Simple moving average , (EMA) Exponential moving average

Second: Momentum (Oscillator) Indicators
Measure the strength and speed of price movement.
(RSI) Relative strength index
Above 70 → Overbought (potential sell)
Below 30 → Oversold (potential buy)
If the price is above the 70 level, this indicates that it has reached overbought conditions, meaning the market is saturated with buy orders or that bulls have reached peak control. In this case, traders prepare to sell.
If the price falls below 30, this indicates oversold conditions, meaning the market is saturated with sell orders or that bears have maximum control. In this case, traders prepare to buy.
Moving average convergence/ Divergence
Consists of:
MACD Line (difference between 12-day EMA and 26-day EMA)
Signal Line (9-period EMA of MACD)
Usage:
Buy when MACD crosses above the signal line
Sell when MACD crosses below the signal line

Stochastic indicator
It compares the current closing price with the price range over a specific period. This range is usually determined by the opening and closing prices over a period of 14 days. It is used to identify overbought and oversold conditions. It consists of levels between 0 and 100. If:
A- Above 80 → Overbought
B – Below 20 → Oversold
C- Divergence with price → Possible reversal

Third: Volatility Indicators
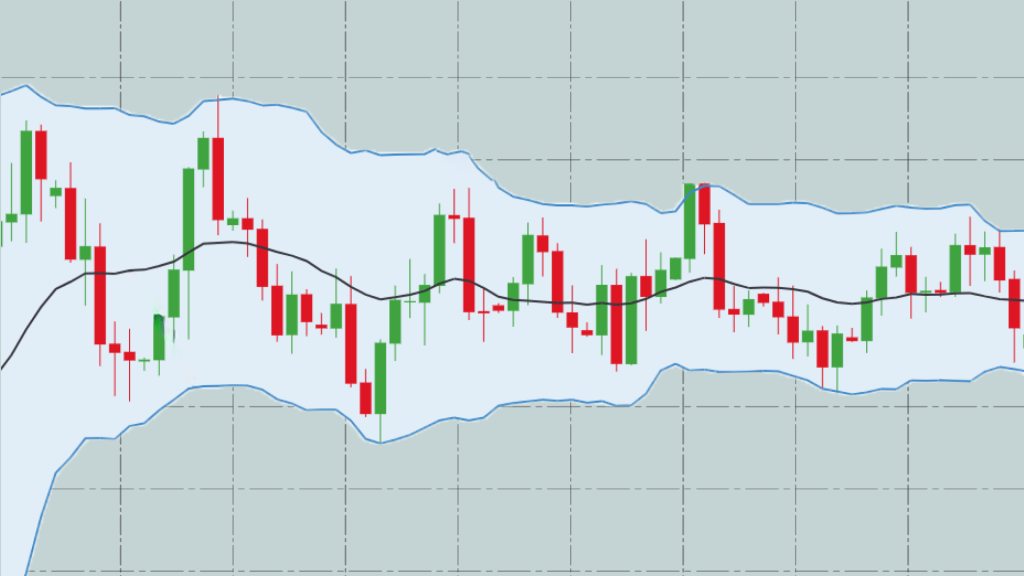
They are indicators that measure the level of market volatility, or the magnitude of price movements between the strength of buyers and sellers, such as Bollinger Bands.
Bollinger bands
Consist of:
Middle Band (20-day SMA)
Upper Band
Lower Band
Usage:
Wider bands → Higher volatility
Narrow bands → Lower volatility
Fourth: Volume Indicators
They are indicators that help illustrate the intensity of trading activity and investor interest in the market. The higher the trading volume, the greater the liquidity, such as the Volume Oscillator indicator.
Volume oscillation
Measures the relationship between price and trading volume.
Usage
Above zero → Increasing volume, trend likely to continue
Helps detect early reversals

Fifth: Support and Resistance Indicators
They are indicators that show the levels at which price may reverse, allowing traders to prepare for potential market reversals, such as Fibonacci levels and pivot points.
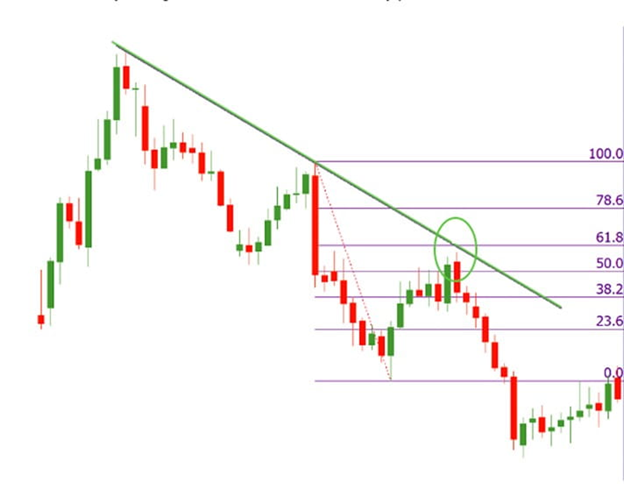
Fibonacci levels
Key levels: 0, 23.6, 38.2, 50, 61.8, 78.6, 100
61.8% is the “golden ratio”
Used to identify potential reversal zones and entry/exit points.
Pivot point
This point is based on the average of the closing price, the highest price, and the lowest price over a specific time period. It represents a central price range around which the price moves up and down. It is a dynamic level that changes as the price moves across different ranges. Above it, there are three resistance levels from which the price may potentially reverse downward, and below it, there are three support levels from which the price may potentially reverse upward.
Calculated as:
Pivot = (High + Low + Close) ÷ 3
Usage:
1- Indicates market direction
2- Helps identify support and resistance levels
Useful for intraday trading
Tips for Using Technical Indicators
1- No indicator is 100% accurate—each has strengths and weaknesses.
2- Avoid using too many similar indicators to prevent confusion.
3- Indicators alone are not sufficient—combine them with other analysis tools.
4- Practice is essential to understand how to use them effectively.
5- Use a combination of indicators for confirmation, but keep it simple.
6- Always test indicators on a demo account before live trading.
What Is the Best Indicator?
There is no single “best” indicator. The ideal choice depends on the trader’s strategy, timeframe, and preferred analytical approach.
From technical analysis course articles:
Introduction to Technical Analysis
Key Technical Analysis Terms
Schools of Technical Analysis
What is Price Action?
Wycoff theory
How to Read Charts